
55% use AI – but the gains don't show up in the accounts

Aage Thorsen
CTO
Two curves that don't meet
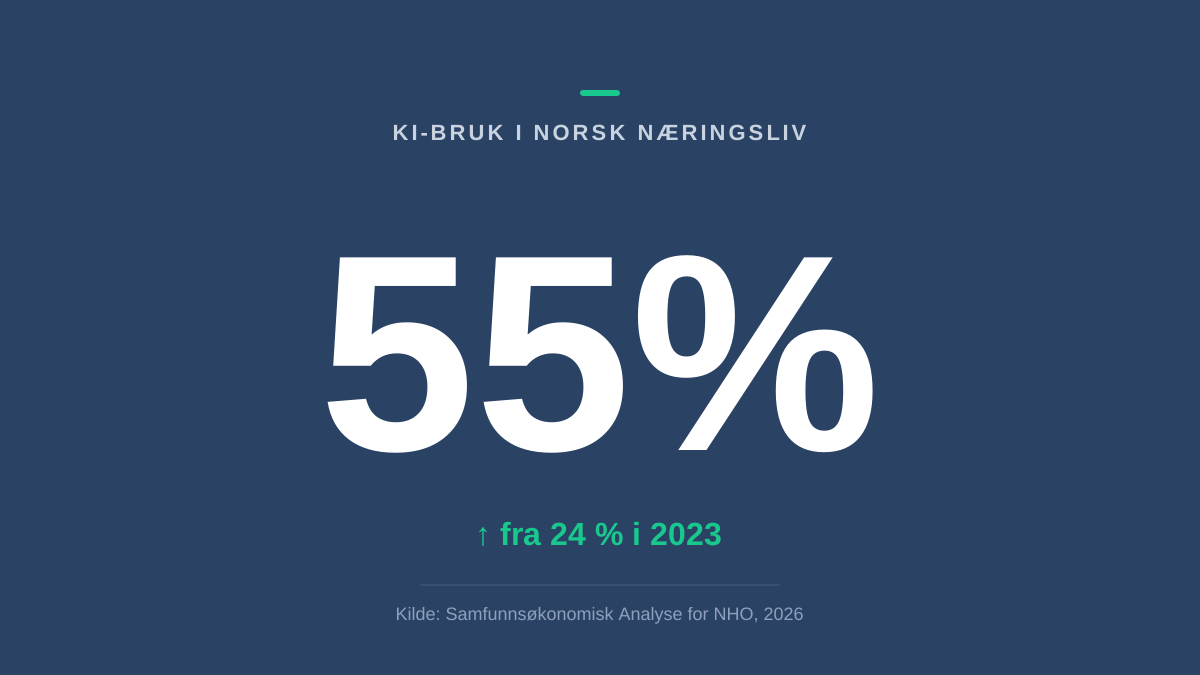
AI adoption in Norwegian business is moving fast. In 2025, 55 percent of companies report using artificial intelligence, up from 24 percent in 2023 – more than a doubling in two years.
At the same time, the report prepared by Samfunnsøkonomisk Analyse for NHO states that most companies do not yet see increased revenues or reduced costs from AI, and that the effects so far cannot be traced in their accounts (Report no. 1-2026).
For most readers, this is a footnote about immature technology. For an accounting firm, it is something quite different: an open position.
What the report actually points to
The explanation the report emphasises is integration. AI is largely used alongside work processes rather than inside them. The companies that have genuinely integrated the technology into operations stand out clearly, with larger productivity gains and more frequent revenue increases than those testing sporadically (NHO).
And here is the detail worth pausing on: the report itself notes that realised productivity development can be measured on accounting data, among other sources – but that the effects are not visible there yet (Report no. 1-2026).
The yardstick has been identified. The measurement has not been made.
The burden of proof sits in the general ledger
Capassa's reading is that an AI gain that leaves no trace in the accounts is not, in practice, a gain. It is a hypothesis.
Consider the mechanics. An employee saves twenty minutes a day using a language model tool. That time has to go one of three places: it becomes lower cost per delivery, it becomes more capacity sold, or it becomes slack that nobody converts into anything.
All three outcomes look identical in a user survey. Only one of them looks different in a profit and loss statement.
That is why the question "did AI work?" is really an accounting question, not a technology question. And it is why the gap the report describes is not primarily a gap in the technology – it is a gap in the measurement.
Who holds the numbers that can settle it
The software vendor has usage statistics and logs. Management has an impression. The consultant has a slide deck.
The accounting firm has the time series: the same chart of accounts, the same accrual principles, the same reconciled basis, year after year. It is the only data source in a Norwegian company consistent enough over time to separate a real change in margin from a good month.
On top of that, the profession has something almost no one else has: the same type of figures for many companies in the same industry and size bracket. Movements in payroll cost per revenue krone, in gross profit, in revenue per full-time equivalent and in days from invoice to payment can be put in context – not as a general market analysis, but against the company's own baseline.
When the report says the effects cannot be traced in the accounts, it is also saying who will eventually be the ones to trace them.
Impact measurement is advisory work, not a data export
The easy counterargument is that clients can pull this out themselves. It does not hold, and the reason is interesting.
Documenting impact requires someone to decide what should be isolated. What was the starting point before the tool was introduced? Which line items are affected, and which changes are caused by something entirely different – a price increase, a lost customer, an employee on leave, a one-off cost? How long should you wait before drawing a conclusion?
That is professional judgement applied to accounting data. It is the definition of advisory work, and it is at the same time standardisable enough to become a packaged delivery: a defined baseline, a small set of key figures, fixed measurement points, a written assessment.
That also lands squarely on the profitability logic of the industry. As AI pushes down the price of producing the accounts themselves, margin shifts towards deliveries that require context about this particular company. Documenting what the technology investments actually did to the numbers is one such delivery – and it is easier to price on value than on hours, because the client cannot get the answer anywhere else.
The measurement window opens with the 2026 accounts
The most concrete thing about the report's timing is this: it describes a situation in which the effects are not yet visible (Report no. 1-2026). If integration keeps rising in step with adoption, it is the accounts of the coming years that will show something else.
In that case, the baseline for the 2027 effect is the 2026 figures. A baseline cannot be established retroactively, and that alone explains why this is a time-limited position rather than a service that can be packaged calmly once the market starts asking.
It also has a staffing dimension. As the volume of manual document handling falls, the question becomes what new employees are supposed to work on. Building and running measurement structures on client data is work analytical enough to be interesting and repeatable enough to be learned – a far better entry portfolio than the rest of what is being automated away.
Two years from now, someone will have the answer to what a client's AI investment was worth. That question is settled in the accounts. The only open question is who delivered the measurement.
More posts
Who gets paid when accounting does more of the work itself?
A new discount agreement between Regnskap Norge and Fiken looks like it's about system costs. But the same hour technology frees up can either be billed away to the customer, or used for advice the customer actually needs.
Shadow AI: one in three use AI outside the firm's control
Everyone reads the new AI numbers as a growth curve. We read them as a governance curve pointing the wrong way: usage has outrun approval, which makes shadow AI a standardisation problem for accounting firms – not a technology problem.
Get new analyses in your inbox
One new post a week, never more. No product ads.
Curious about how Capassa works in practice?
Get in touch